dmPlotProfile
Description
Plot DNA methlation profile across gene/ TE/ predefined bed region, such as peak or dmr region. The input DNA methylation level matrix is produced by dmtools profile command.
Usage and example
Needed matrix files
The *.profile.tss.aver *.profile.acorss.aver and *.profile.center.aver are calulated by dmtools profile.
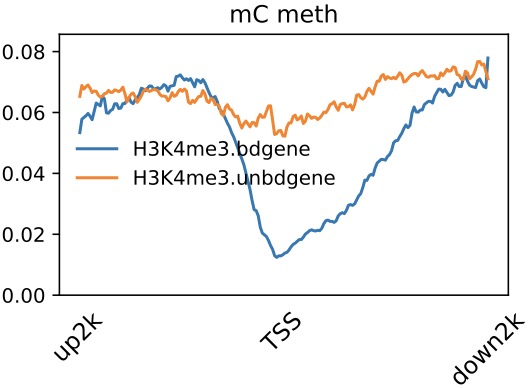
Profile across TSS
$ dmtools profile -i sample1.methratio.dm --bed H3K4me3.bdgene.bed -o H3K4me3.bdgene.profile \
  --regionextend 2000 --bodyX 1 --matrixX 5 --profilemode 1

$ dmtools profile -i sample1.methratio.dm --bed H3K4me3.unbdgene.bed -o H3K4me3.unbdgene.profile \
  --regionextend 2000 --bodyX 1 --matrixX 5 --profilemode 1

$ dmPlotProfile.py -f H3K4me3.bdgene.profile.tss.aver \
    H3K4me3.unbdgene.profile.tss.aver \
    -l H3K4me3.bdgene H3K4me3.unbdgene \
    --outFileName H3K4me3.output.meth.pdf \
    -s 1 1 -xl up2k TSS down2k --context C
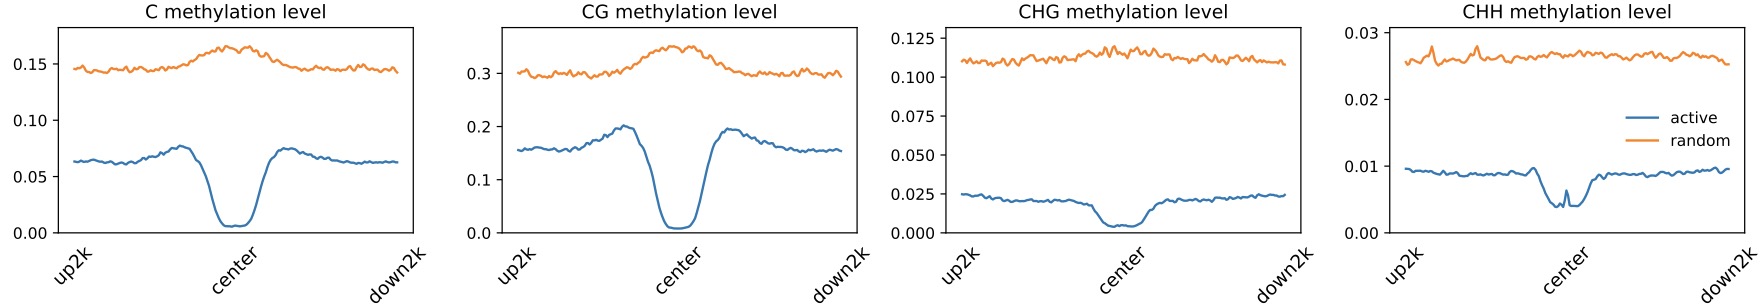
Profile across gene/region center
$ dmtools profile -i sample1.methratio.dm --bed active.bed -o active.profile \
  --regionextend 2000 --bodyX 1 --matrixX 5 --profilemode 3

$ dmtools profile -i sample1.methratio.dm --bed random.bed -o random.profile \
  --regionextend 2000 --bodyX 1 --matrixX 5 --profilemode 3

$ dmPlotProfile.py -f active.profile.center.aver \
    random.profile.center.aver \
    -l active random \
    --outFileName active_random.output.meth.pdf \
    -s 1 1 -xl up2k center down2k
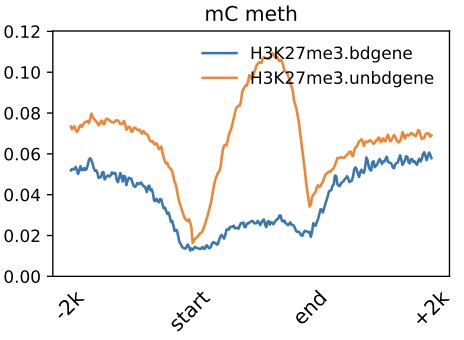
Profile across Gene
$ dmtools profile -i sample1.methratio.dm --bed H3K4me3.bdgene.bed -o H3K4me3.bdgene.profile \
  --regionextend 2000 --bodyX 1 --matrixX 5 --profilemode 0

$ dmtools profile -i sample1.methratio.dm --bed H3K4me3.unbdgene.bed -o H3K4me3.unbdgene.profile \
  --regionextend 2000 --bodyX 1 --matrixX 5 --profilemode 0

$ dmPlotProfile.py -f H3K27me3.bdgene.profile.avarage.across.aver \
    H3K27me3.unbdgene.profile.across.aver \
    -l H3K27me3.bdgene H3K27me3.unbdgene \
    --outFileName H3K27me3.output.meth.pdf \
    -s 1 1 1 -xl up2k TSS TES down2k
Parameters
-f MRFILE [MRFILE ...], --mrfile MRFILE [MRFILE ...]DNA AverMethylevel files, seperate by space. eg. wildtype.AverMethy.txt
-l LABEL [LABEL ...], --label LABEL [LABEL ...]Labels of samples, sperate by space. eg. -l widetype
--outFileName FILENAME, -o FILENAMEOutput file name.
--sample SAMPLE [SAMPLE ...]The interval of N data is a group, and the average value is taken as the representative. Please note that the number of labels should correspondto the number of samples after averaging.
-s SCALE [SCALE ...], --scale SCALE [SCALE ...]Visual X-axis spacing, default upsteam:body:downstream is 1:1:1 (-s 1 1 1), which should be consistent with -b and -bl parameters in BatMeth2:methyGff,and separated by spaces
-xl XLABEL [XLABEL ...], --xlabel XLABEL [XLABEL ...]Consistent with the -s parameter, if the -s parameter is 1 1 1, i.e. 1:1:1,then the corresponding X-axis label is UP TSS TES Down
-yl YLABEL, --ylabel YLABELy-axis label
-t TITLE [TITLE ...], --title TITLE [TITLE ...]Title of the plot, to be printed on top of the generated image. Leave blank for no title.
--yMin YMIN [YMIN ...]Minimum value for the Y-axis. Multiple values, separated by spaces can be set for each profile. If the number of yMin values is smaller thanthe number of plots, the values are recycled.
--yMax YMAX [YMAX ...]Maximum value for the Y-axis. Multiple values, separated by spaces can be set for each profile. If the number of yMin values is smaller thanthe number of plots, the values are recycled.
--color COLOR [COLOR ...]List of colors to use, should same as the number of samples,Color names and html hex strings (e.g., #eeff22) are accepted. The color names should be space separated. For example, --color red blue green
--legend {0,1,2,3,4,5,6,7,8,9,10,11,12}The location of the legend. best : 0, upper right : 1, upper left : 2, lower left : 3, lower right : 4, right : 5, center left : 6, center right: 7, lower center: 8, upper center: 9, center : 10, out : 11, none : 12
--lastlegend LASTLEGENDOnly show the last figure's legend.
--legendsize LEGENDSIZEthe text size of the legend.
--context CONTEXT- List of colors to use, should same as the number of samples,Color names and html hex strings (e.g., #eeff22) are accepted. The
color names should be space separated. For example, --color red blue green
--pergroup PERGROUPplot cg/ch of the same sample in one fig,only useful when have more than 1 sample input file
-ft IMAGE_FORMAT, --image_format IMAGE_FORMATThe file format, e.g. 'png', 'pdf', 'svg', ... The behavior when this is unset is documented under fname.
--dpi DPISet the DPI to save the figure. default: 200
Tip
For feature requests or bug reports please open an issue on github.