dmPlotHeatmap
Description
Heatmap visualization for DNA methylation across genes or DMRs. The input files can be generated by dmtools profile and dmtools bodystats command.
Usage and example
$ dmtools profile -i sample1.methratio.dm --bed H3K4me3.bdgene.bed -o H3K4me3.bdgene.profile \
  --regionextend 2000 --bodyX 1 --matrixX 5 --profilemode 0

$ python dmPlotHeatmap.py -m H3K4me3.bdgene.profile.cg -l bg \
-o test0.pdf -z k43 -sl TSS -el TTS

$ dmtools profile -i sample1.methratio.dm --bed H3K4me3.bdgene.bed -o H3K4me3.bdgene.profile \
--regionextend 2000 --bodyX 1 --matrixX 5 --profilemode 1
$ dmtools profile -i sample1.methratio.dm --bed H3K4me3.bdgene.bed -o H3K4me3.bdgene.profile \
--regionextend 2000 --bodyX 1 --matrixX 5 --profilemode 2
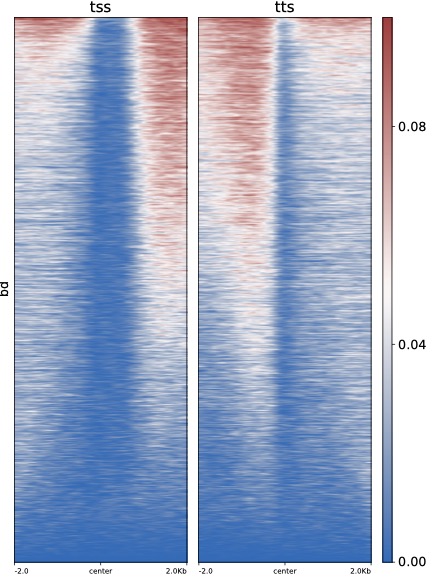
$ python dmPlotHeatmap.py -m H3K4me3.bdgene.profile.tss.cg H3K4me3.bdgene.profile.tts.cg \
-l tss tts -o test.pdf --zMax 0.1 --colorMap vlag --centerlabel center -z bd
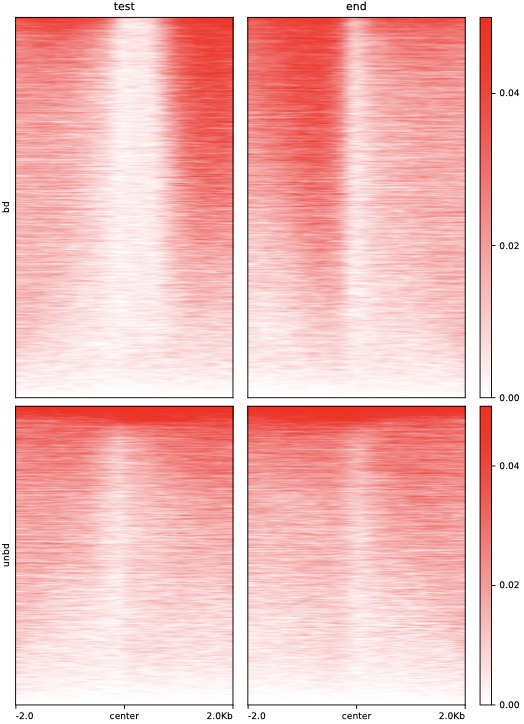
$ python dmPlotHeatmap.py -m H3K4me3.bdgene.profile.tss.cg H3K4me3.bdgene.profile.tts.cg \
    H3K4me3.unbdgene.profile.tss.cg H3K4me3.unbdgene.profile.tts.cg \
    -l test end -o test2.pdf --zMax 0.05 --centerlabel center \
    --plotmatrix 2x2 --colorList white,red -z bd unbd
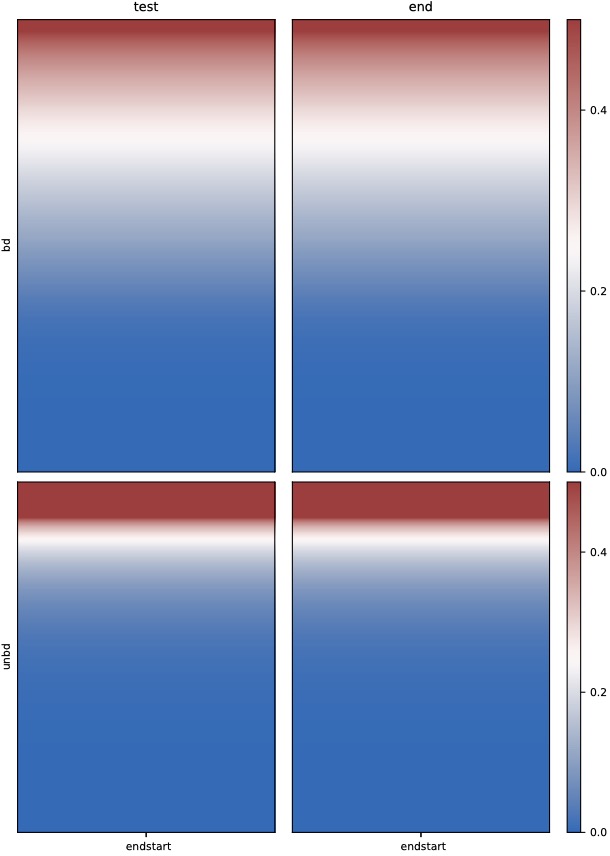
$ dmtools bodystats --gtf H3K4me3.bdgene.gtf -i ./test.methratio.dm \
  -o H3K4me3.bdgene --strand 3 --context 4 --printcoverage 1

$ python dmPlotHeatmap.py -f H3K4me3.bdgene.bodym.cover.cg H3K4me3.bdgene.bodym.cover.cg \
    H3K4me3.unbdgene.bodym.cover.cg H3K4me3.unbdgene.bodym.cover.cg \
    -l test end -o test3.pdf --zMax 0.5 --centerlabel center \
    --plotmatrix 2x2 -z bd unbd
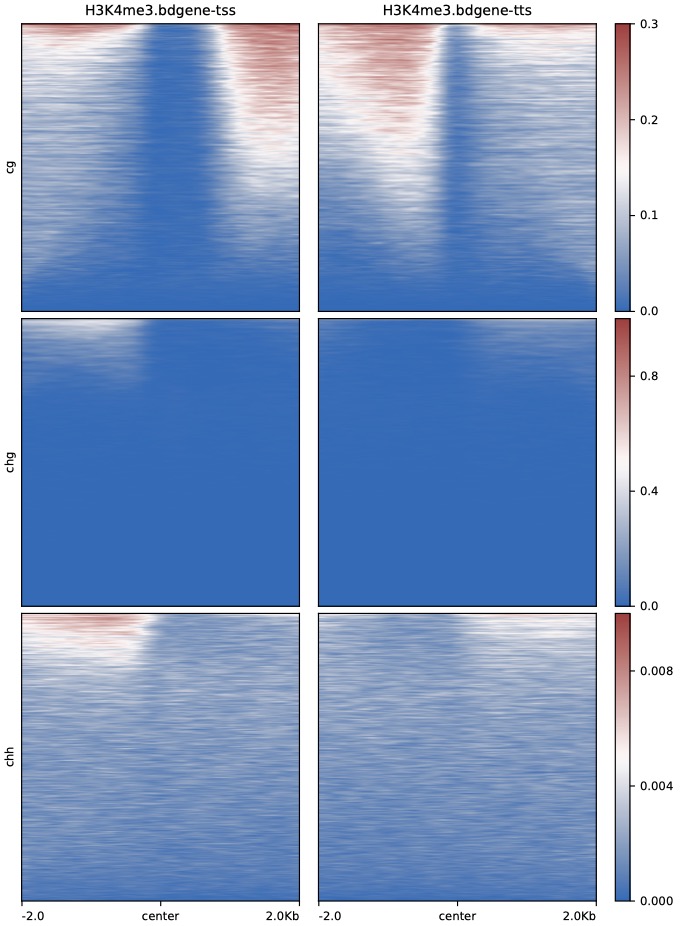
$ python dmPlotHeatmap.py -m H3K4me3.bdgene.profile.tss.cg H3K4me3.bdgene.profile.tts.cg \
    H3K4me3.bdgene.profile.tss.chg H3K4me3.bdgene.profile.tts.chg \
    H3K4me3.bdgene.profile.tss.chh H3K4me3.bdgene.profile.tts.chh \
    -l H3K4me3.bdgene-tss H3K4me3.bdgene-tts \
    -o H3K4me3.bdgene.TSS_TTS.heatmap.pdf --plotmatrix 3x2 \
    --centerlabel center -z cg chg chh --zMax 0.3 1 0.01
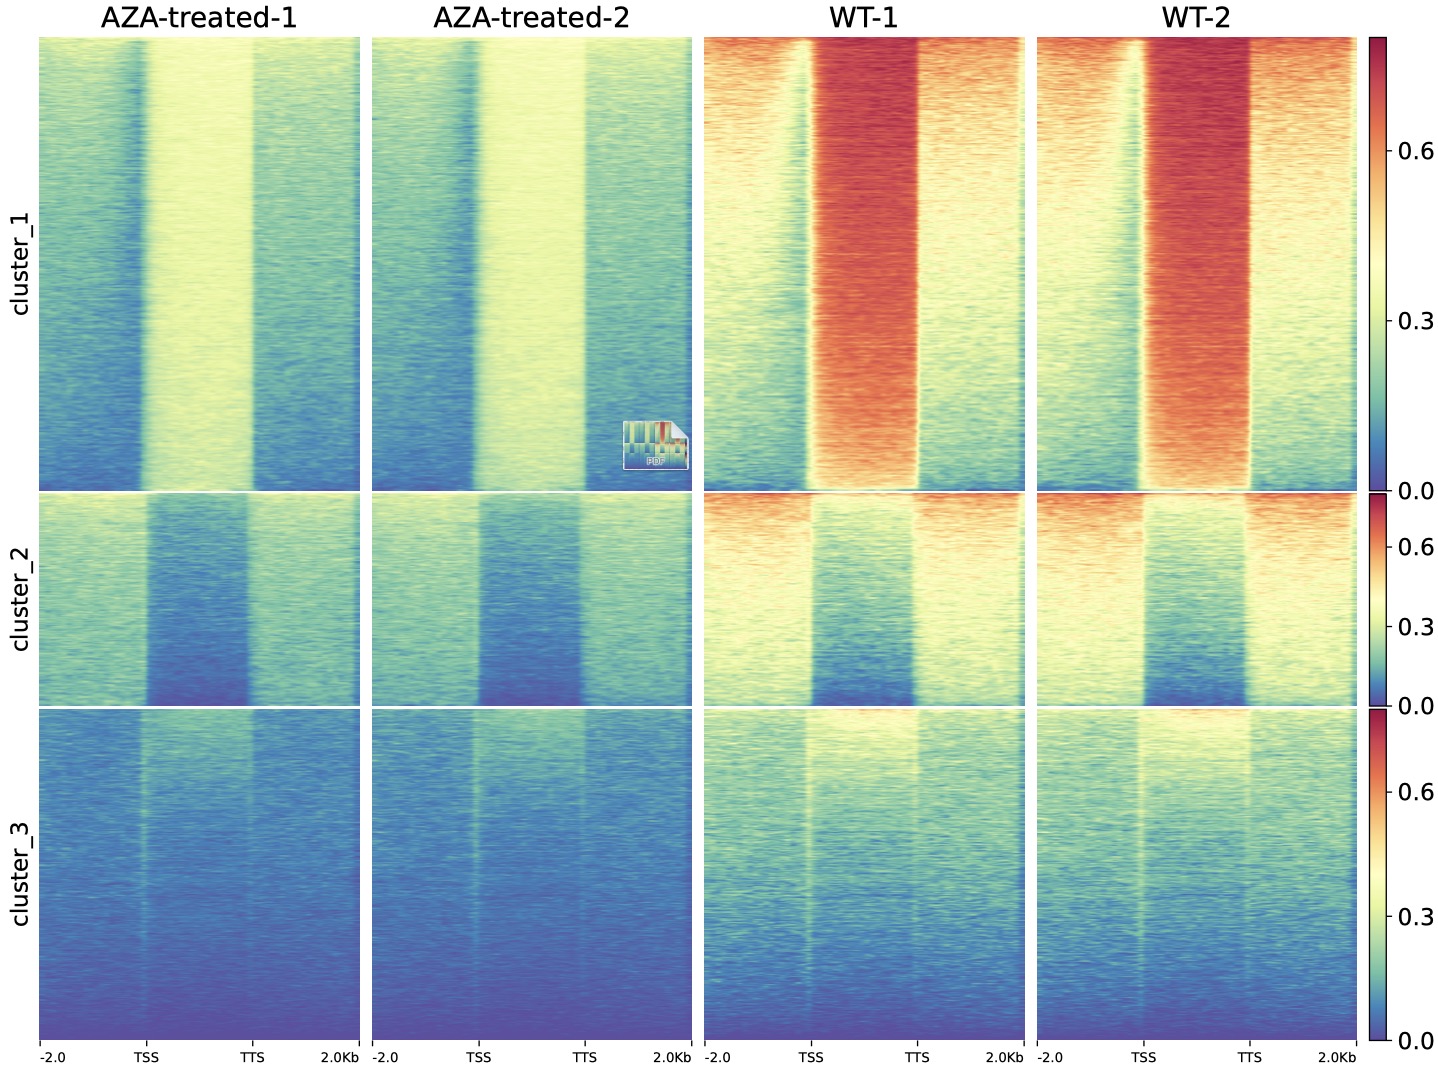
We also used DMtools in AZA-AML BS-Seq data
$ python3 dmPlotHeatmap.py -m GSM1329865.profile.cg GSM1329866.profile.cg GSM1329867.profile.cg GSM1329868.profile.cg \
-l AZA-treated-1 AZA-treated-2 WT-1 WT-2 -o dnmt.heatmap.pdf \
-sl TSS -el TTS --zMax 0.8 --colorMap Spectral_r --kmeans 3
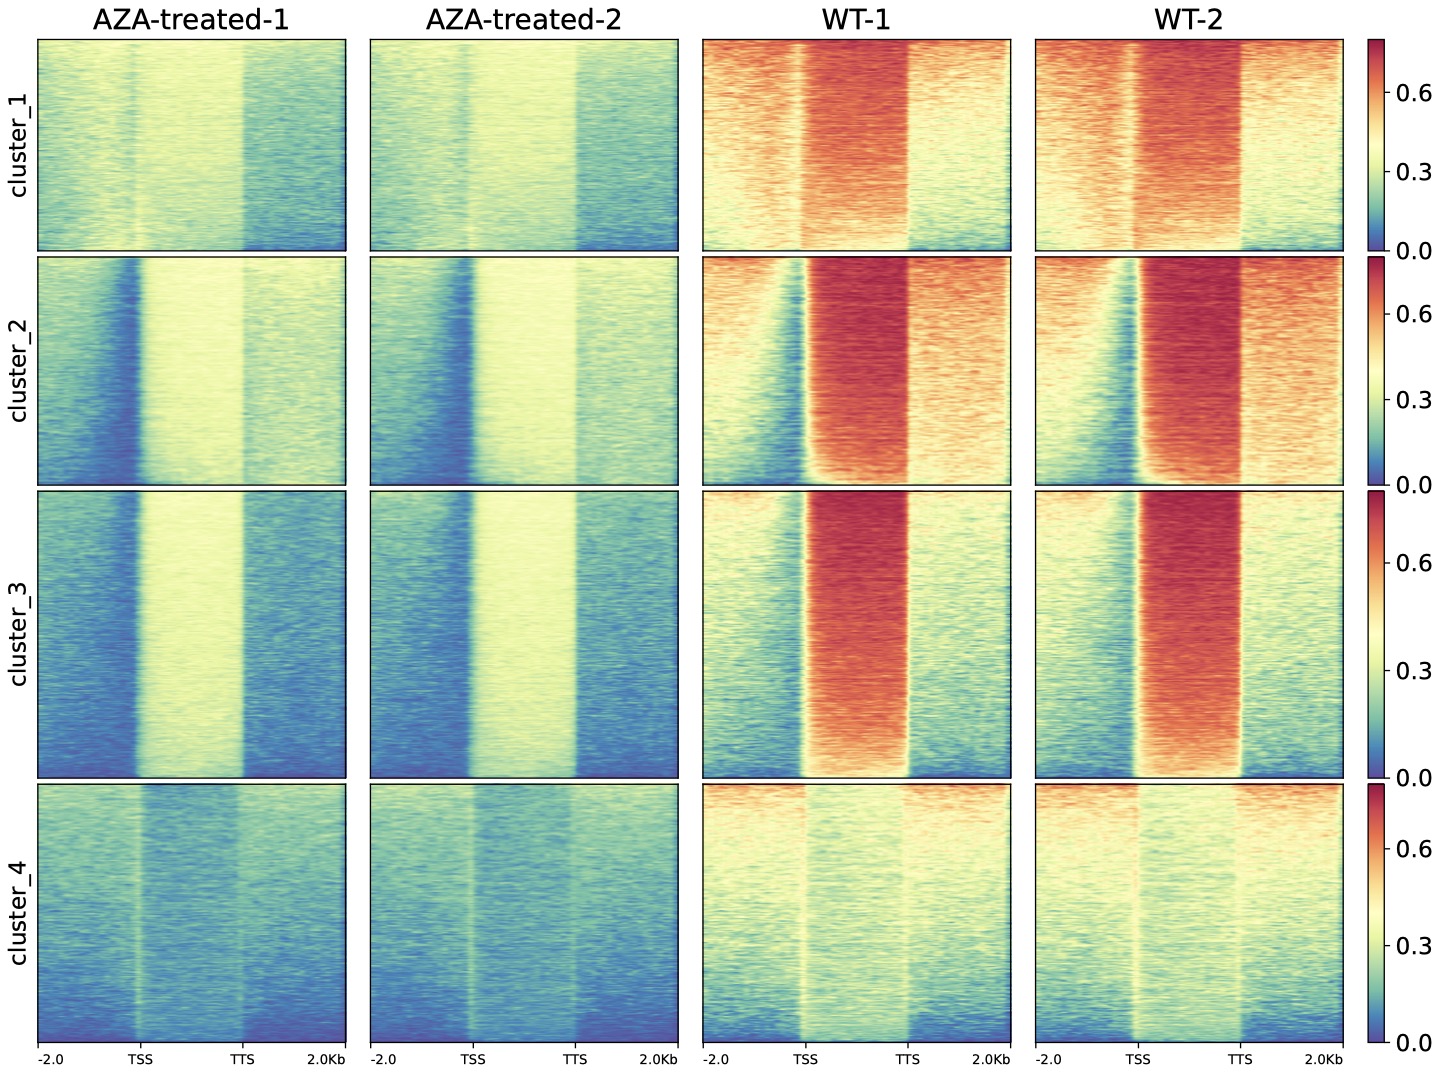
AZA-AML vs AML DMR-related gene heatmap
Parameters
-f MRFILE [MRFILE ...], --mrfile MRFILE [MRFILE ...]input methylevel files, wildtype.body.c*.txt
-m MATRIXFILE [MATRIXFILE ...], --matrixfile MATRIXFILE [MATRIXFILE ...]input methylevel matrix files, wildtype.GENE.cg.txt
-l SAMPLESLABEL [SAMPLESLABEL ...], --samplesLabel SAMPLESLABEL [SAMPLESLABEL ...]the label of the samples
-z GROUPLABELS [GROUPLABELS ...], --groupLabels GROUPLABELS [GROUPLABELS ...]Labels for the regions plotted in the heatmap. If more than one region is being plotted, a list of labels separated by spaces is required. If a label itself contains a space, then quotes are needed. For example, --groupLabels label_1, "label 2". should be same length as --kmeans if kmeans valid
-sl STARTLABEL, --startlabel STARTLABELthe start label of the samples
-el ENDLABEL, --endlabel ENDLABELthe end label of the samples
-pl CENTERLABEL, --centerlabel CENTERLABELthe center label of the samples
--plotmatrix PLOTMATRIX1x1, default, row x col, order by columun, for exsample, 2x3 :file1 file2 file3file4 file5 file6
--outFileName FILENAME, -o FILENAMEOutput file name.
-c COLORMAP [COLORMAP ...], --colorMap COLORMAP [COLORMAP ...]Color map to use for the heatmap. If more than one heatmap is being plotted the color of each heatmap can be enter individually (e.g. --colorMap Reds Blues).The available options are: 'magma', 'inferno', 'plasma', 'viridis', 'cividis', 'twilight', 'twilight_shifted', 'turbo', 'Blues', 'BrBG', 'BuGn', 'BuPu', 'CMRmap', 'GnBu', 'Greens', 'Greys', 'OrRd', 'Oranges', 'PRGn', 'PiYG', 'PuBu', 'PuBuGn', 'PuOr', 'PuRd', 'Purples', 'RdBu', 'RdGy', 'RdPu', 'RdYlBu', 'RdYlGn', 'Reds', 'Spectral', 'Wistia', 'YlGn', 'YlGnBu', 'YlOrBr', 'YlOrRd', 'afmhot', 'autumn', 'binary', 'bone', 'brg', 'bwr', 'cool', 'coolwarm', 'copper', 'cubehelix', 'flag', 'gist_earth', 'gist_gray', 'gist_heat', 'gist_ncar', 'gist_rainbow', 'gist_stern', 'gist_yarg', 'gnuplot', 'gnuplot2', 'gray', 'hot', 'hsv', 'jet', 'nipy_spectral', 'ocean', 'pink', 'prism', 'rainbow', 'seismic', 'spring', 'summer', 'terrain', 'winter', 'Accent', 'Dark2', 'Paired', 'Pastel1', 'Pastel2', 'Set1', 'Set2', 'Set3', 'tab10', 'tab20', 'tab20b', 'tab20c', 'rocket', 'mako', 'icefire', 'vlag', 'flare', 'crest'
--alpha ALPHAThe alpha channel (transparency) to use for the heatmaps. The default is 1.0 and values must be between 0 and 1.
--colorList COLORLIST [COLORLIST ...]List of colors to use to create a colormap. For example, if --colorList black,yellow,blue is set (colors separated by comas) then a color map that starts with black, continues to yellow and finishes in blue is created. If this option is selected, it overrides the --colorMap chosen. The list of valid color names can be seen here: http://matplotlib.org/examples/color/named_colors.html The number of transitions is defined by the --colorNumber option.
--colorNumber COLORNUMBER--colorList is required for an effect. This controls the number of transitions from one color to the other. If --colorNumber is the number of colors in --colorList then there will be no transitions between the colors.
--missingDataColor MISSINGDATACOLORIf --missingDataAsZero was not set, such cases will be colored in white by default.
--sortRegions {descend,ascend,no}Whether the heatmap should present the regions sorted. The default is to sort in descending order based on the mean value per region.
--sortUsing {mean,median,max,min,sum}Indicate which method should be used for sorting. For each row the method is computed.
--sortUsingSamples SORTUSINGSAMPLES [SORTUSINGSAMPLES ...]List of sample numbers (order as in matrix), which are used by --sortUsing for sorting. If no value is set, it uses all samples. Example: --sortUsingSamples 1 3
--linesAtTickMarksDraw dashed lines from all tick marks through the heatmap. This is then similar to the dashed line draw at region bounds when using a reference point and --sortUsing region_length
--clusterUsingSamples CLUSTERUSINGSAMPLES [CLUSTERUSINGSAMPLES ...]List of sample numbers (order as in matrix), that are used for clustering by --kmeans or --hclust if not given, all samples are taken into account for clustering. Example: --ClusterUsingSamples 1 3
--kmeans KMEANSNumber of clusters to compute. When this option is set, the matrix is split into clusters using the k-means algorithm. Only works for data that is not grouped, otherwise only the first group will be clustered.
--hclust HCLUSTNumber of clusters to compute. When this option is set, then the matrix is split into clusters using the hierarchical clustering algorithm, using "ward linkage". Only works for data that is not grouped, otherwise only the first group will be clustered. --hclust could be very slow if you have >1000 regions. In those cases, you might prefer --kmeans or if more clustering methods are required you can save the underlying matrix and run the clustering using other software. The plotting of the clustering may fail with an error if a cluster has very few members compared to the total number of regions.
-s SCALE [SCALE ...], --scale SCALE [SCALE ...]Maximum value for the Y-axis. Multiple values, separated by spaces can be set for each profile. If the number of yMin values is smaller thanthe number of plots, the values are recycled.
-t TITLE [TITLE ...], --title TITLE [TITLE ...]Title of the plot, to be printed on top of the generated image. Leave blank for no title.
--zMin ZMIN [ZMIN ...]Values to anchor the colormap
--zMax ZMAX [ZMAX ...]Values to anchor the colormap, Maximum value for the heatmap.
-ft IMAGE_FORMAT, --image_format IMAGE_FORMATThe file format, e.g. 'png', 'pdf', 'svg', ... The behavior when this is unset is documented under fname.
--perGroupThe default is to plot all groups of regions by sample. Using this option instead plots all samples by group of regions. Note that this is only useful if you have multiple groups of regions. by sample rather than group.
--dpi DPISet the DPI to save the figure. default: 100
--figsize FIGSIZESet the figure size to save the figure. [with]x[height], default: 1.5x11
--boxAroundHeatmaps BOXAROUNDHEATMAPSBy default black boxes are plot around heatmaps. This can be turned off by setting --boxAroundHeatmaps no
Tip
For feature requests or bug reports please open an issue on github.